manD 1.0
Data structure

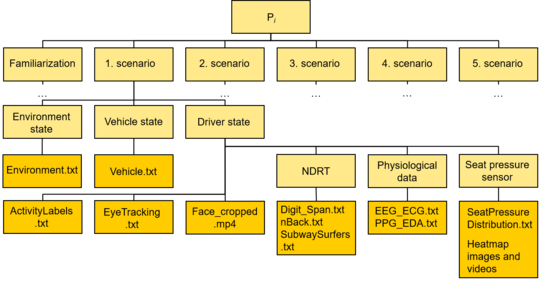
The dataset is structured into distinct levels, as illustrated. It comprises data from two groups of participants: those who experienced motion sickness during the experiment (labeled as withMS) and those who did not (labeled as withoutMS), each stored in separate directories with identical organization. The quantity of data from participants who suffered motion sickness is smaller due to it being collected only until they began showing clear symptoms like nausea and dizziness, primarily during initial familiarization drives.
Each participant's data is contained within compressed folders (e.g., P1.7z, P2.7z), which include one or more familiarization drives and maximum five driving scenarios, all of which are also zipped in the dataset. The information from each driving scenario is further divided into three categories: "EnvironmentState," detailing the external conditions and other vehicles as simulated; "VehicleState," focusing on the dynamics of the vehicle being driven; and "DriverState," which compiles data from all sensors monitoring the driver.
The "DriverState" section is elaborated to include data from individual sensors, encompassing physiological measurements, seat pressure distributions, eye-tracking details, camera footage, non-driving related task (NDRT) performances, and activity annotations. A concise description of the data files present in the dataset can be found at Link
Citation
Dataset:
Dargahi Nobari, Khazar and Bertram, Torsten. (2023). ‘manD 1.0’. Available at: doi.org/10.7910/DVN/SG9TMD.
Experimental design and explanations:
Dargahi Nobari, K., T. Bertram: “A multimodal driver monitoring benchmark dataset for driver modeling in assisted driving automation,” Scientific Data, vol. 11, no. 1, Mar. 2024, doi: 10.1038/s41597-024-03137-y.


